Note: Our latest 2019 climate report Survival By Degrees can be found here. The below FAQ is regarding our previous 2014 report.
Frequently Asked Questions
- What is the Audubon Birds and Climate Report?
- What are the primary findings?
- Where can I read the full report?
- Where can I find peer-reviewed scientific papers on the study?
- What geographical range does the study cover?
- How are birds where I live projected to respond to global warming?
- Are birds with ranges that are shown to expand or shift “safe” from climate change?
- How do I interpret the projected range maps?
- How do I interpret the Venn diagrams?
- Why can’t I find maps for a specific bird?
- Are the projected range maps different from the range maps in field guides?
- Will Audubon continue to conduct research into how global warming affects birds?
- What can I do to help?
- Got even more questions? CEO and President David Yarnold and chief scientist Gary Langham have answers.
What is the Audubon Birds and Climate Report?
It is a comprehensive, first-of-its kind study that predicts how climate change could affect the ranges of 588 North American birds.
Audubon scientists used three decades of citizen-scientist observations from the Audubon Christmas Bird Count and the North American Breeding Bird Survey to define the “climatic suitability” for each bird species—the range of temperatures, precipitation, and seasonal changes each species needs to survive. Then, using internationally recognized greenhouse gas emissions scenarios, they mapped where each bird’s ideal climatic range may be found in the future as the climate changes. These maps serve as a guide to how each bird’s current range could expand, contract, or shift across three future time periods (2020, 2050, and 2080). Back to top
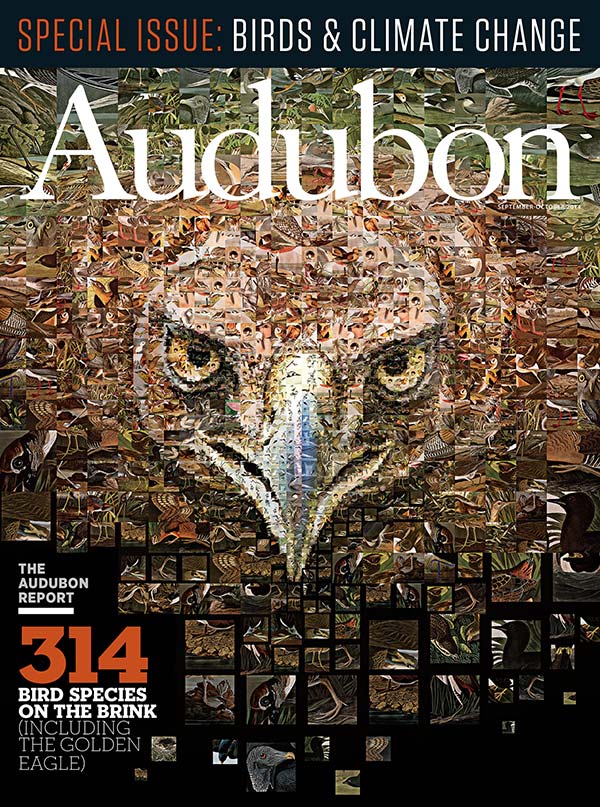
What are the primary findings?
Of the 588 North American bird species Audubon studied, more than half are likely to be in trouble. Our models indicate that 314 species will lose more than 50 percent of their current climatic range by 2080.
Of the 314 species at risk from global warming, 126 of them are classified as climate endangered. These birds are projected to lose more than 50 percent of their current range by 2050. The other 188 species are classified as climate threatened and expected to lose more than 50 percent of their current range by 2080 if global warming continues at its current pace. Back to top
Where can I read the full report?
You can download a summary overview of the Audubon Climate Report in PDF form here, as well as the full Landscape Conservation Cooperatives report PDF here. The LCC report was the foundation of work for the Audubon Climate Report and provides detailed methods. Back to top
Where can I find peer-reviewed scientific papers on the study?
- Langham GM, Schuetz JG, Distler T, Soykan CU, Wilsey C (2015) Conservation Status of North American Birds in the Face of Future Climate Change. PLoS ONE 10(9): e0135350. doi:10.1371/journal.pone.0135350 [journals.plos.org]
- Schuetz et al., Making Spatial Prioritizations Robust to Climate Change Uncertainties: A Case Study with North American Birds, Ecological Applications, 2015: [esajournals.org]
- Distler et al., Stacked Species Distribution Models and Macroecological Models Provide Congruent Projections of Avian Species Richness Under Climate Change, Journal of Biogeography, 2015: [onlinelibrary.wiley.com] Back to top
What geographical range does the study cover?
The study covers Alaska, Canada, and the lower 48 states. Dozens of North American birds winter in Latin America, but because we lacked sufficient data to study the effects of global warming on those birds’ winter ranges, it is likely that even more birds are threatened by global warming than we have been able to identify so far. Back to top
How are birds where I live projected to respond to global warming?
Visit our search page to find birds by state/province or species name. Back to top
Are birds with ranges that are shown to expand or shift “safe” from climate change?
Not necessarily. Our models look at the most fundamental climate needs each species requires for survival; they do not take specifics of habitat into account. A place in a grassland bird’s new projected range might have the right mix of temperature and seasonality, but if that place is a major city instead of a grassland, the bird is not going to thrive there. Back to top
How do I interpret the range maps?
Each map is an animated guide to where a particular bird species may find the climate conditions it needs to survive in three future time periods (2020, 2050, and 2080). We call this the bird’s “climatic range.”
The shaded areas indicate where the bird may find suitable climate conditions for each time period. They are color-coded by season: blue for winter, yellow for summer (breeding season), and green for where they overlap (indicating the bird’s presence year-round). The darker the shaded area, the more likely it is the bird will find suitable climate conditions in that area.
The first frame of the animation shows where the bird can find a suitable climate today (based on data from 2000). The outline of the approximate current range for each season remains fixed in each frame, allowing you to compare how the range will expand, contract, or shift in the future.
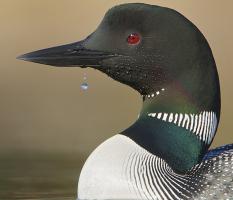
The map above shows the projected range of the Common Loon. By 2080, the call of the loon may disappear from Minnesota in the summer as its breeding range moves north. Its winter range is even more heavily affected, declining 62 percent by 2050. Back to top
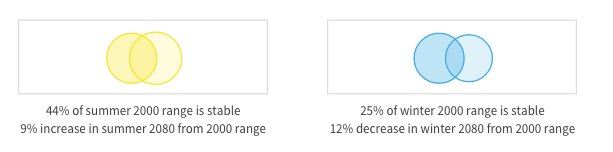
How do I interpret the Venn diagrams?
The size of the circles roughly indicates the species’ range size in 2000 (left) and 2080 (right). The amount of overlap between the 2000 circle and the 2080 circle indicates how stable the range will be geographically. Lots of overlap means the bird’s range doesn’t shift much. No overlap means the species will leave its current range entirely.
The Venn diagrams above represent the current and projected 2080 range of the Common Loon. Back to top
Why can’t I find maps for a specific bird?
Right now, maps are available on audubon.org for the 314 birds our model identifies as either climate endangered or climate threatened. In the future, we will expand these to include additional birds from the study. Back to top
Are the projected range maps different from the range maps in field guides?
Our maps show the probability of a bird occurring in a location based on the climate in that area and the birds’ known climatic needs. As such, they are an important part of a larger conversation about where birds occur today and will occur in the future. If a species is poorly known or hard to detect, or if it occurs in some places at the margins of it climatic tolerance zone, certain visualizations of this information on a map may lead to depictions that don’t fully match observations in the field. This, of course, is true of any range map or model, and we’re continually working to refine how we project and interpret the data.
The solid lines on the maps depict a conservative core range area from the year 2000. In some cases, birds’ current ranges can be broader than suggested by these lines. The colored pixels are a better representation of likely range, but for some species these might be too faint to see clearly in certain web representations, depending on monitor settings and other factors. The underlying information behind the maps provides a framework for understanding which birds are most threatened by global warming and which places are most important for birds so that we can start taking action to protect them. We know that this information will help us make good decisions to help birds, and we know that the maps will keep getting better as we crowdsource the collection of more data about where birds are now and how they’re responding to climate change. Back to top
Will Audubon continue to conduct research into how global warming affects birds?
Audubon’s scientists are already furthering the climate research in many ways. They’re identifying priority areas for conservation, the “strongholds” where birds live now and that are forecast to remain critical for birds even as the climate changes. Audubon’s scientists are also already working to incorporate additional data to generate even more robust projections. Next they will try to clarify how places the current model points to as climatically suitable for species in the future could fall short in other ways: They could be developed areas with roads and parking lots, for instance, or be impossible for a species to reach because of distance or fragmentation. And as more data become available, they’ll incorporate the information into the models to continue refining our understanding of how global warming will affect birds. Back to top
What can I do to help?
Audubon’s new science sends a clear message about the serious dangers birds face in a warming world. Protecting them will require both redoubling conservation efforts to safeguard critical habitat and curbing greenhouse gas emissions.
Take the pledge to help protect the 314 birds at risk by providing your email address below. You'll receive the latest findings, be the first to hear about climate-related volunteer opportunities in your state or local area, and see how you can enlist in Audubon’s forthcoming citizen science projects to help monitor birds and document how they respond to a changing climate.
And for even more actions, see our guide to five things you can do right now to make a difference for birds threatened by climate change. Back to top
Got even more questions? CEO and President David Yarnold and chief scientist Gary Langham have answers.
Listen to David Yarnold and Gary Langham answer questions about the climate study in a town hall phone call.